Veterinary Blood Glucose Meter 101: How It Works and When to Use It
Share
A veterinary glucose meter converts enzyme-driven electron flow from a <0.6 µL blood sample into a calibrated value, correcting for temperature and hematocrit. Use species mode (dog/cat) to adjust slope/intercept and avoid bias. Strips’ chemistry and capillary design control fill speed and accuracy. Check targets (dogs: 90–180 mg/dL; cats: 80–200 mg/dL), monitor trends, and verify at the clinic for complex cases and periodic audits. Maintain QC, replace batteries, and retire worn units. Next, you’ll see how to apply this safely.
What a Veterinary Blood Glucose Meter Does
Although compact, a veterinary blood glucose meter quantifies an animal’s blood glucose by analyzing a small capillary sample with enzyme-based electrochemical sensors. You initiate glucose monitoring, and the device converts enzyme-mediated electron transfer into a calibrated concentration, compensating for temperature and hematocrit to maintain accuracy. Its meter functionality includes rapid signal acquisition, onboard algorithms for species-specific bias, and flagging of hypo- and hyperglycemic thresholds you set. You get numeric outputs in seconds, enabling tight insulin titration and trend analysis across visits. Data export supports telemetric review, while quality checks verify signal integrity, preventing decisions on noisy reads and reducing clinical risk.
Key Components: Strips, Sensors, and Sample Volume
Hardware drives accuracy: disposable strips channel a microliter-scale blood sample to an enzyme-coated working electrode, a reference/counter electrode, and contact pads that mate with the meter. Capillary geometry and hydrophilic coatings control fill speed and dead volume. You’ll choose strip types by enzyme chemistry (glucose oxidase vs. dehydrogenase) and hematocrit tolerance. Onboard temperature/impedance checks flag partial fills. The sensor converts electron flux to current; the meter applies amperometry, filters noise, and computes glucose. Smaller sample volume (<0.6 µL) reduces redraw risk. Tight manufacturing tolerances, lot coding, and fluidics alignment drive sensor accuracy, minimize bias, and support rapid, repeatable measurements.
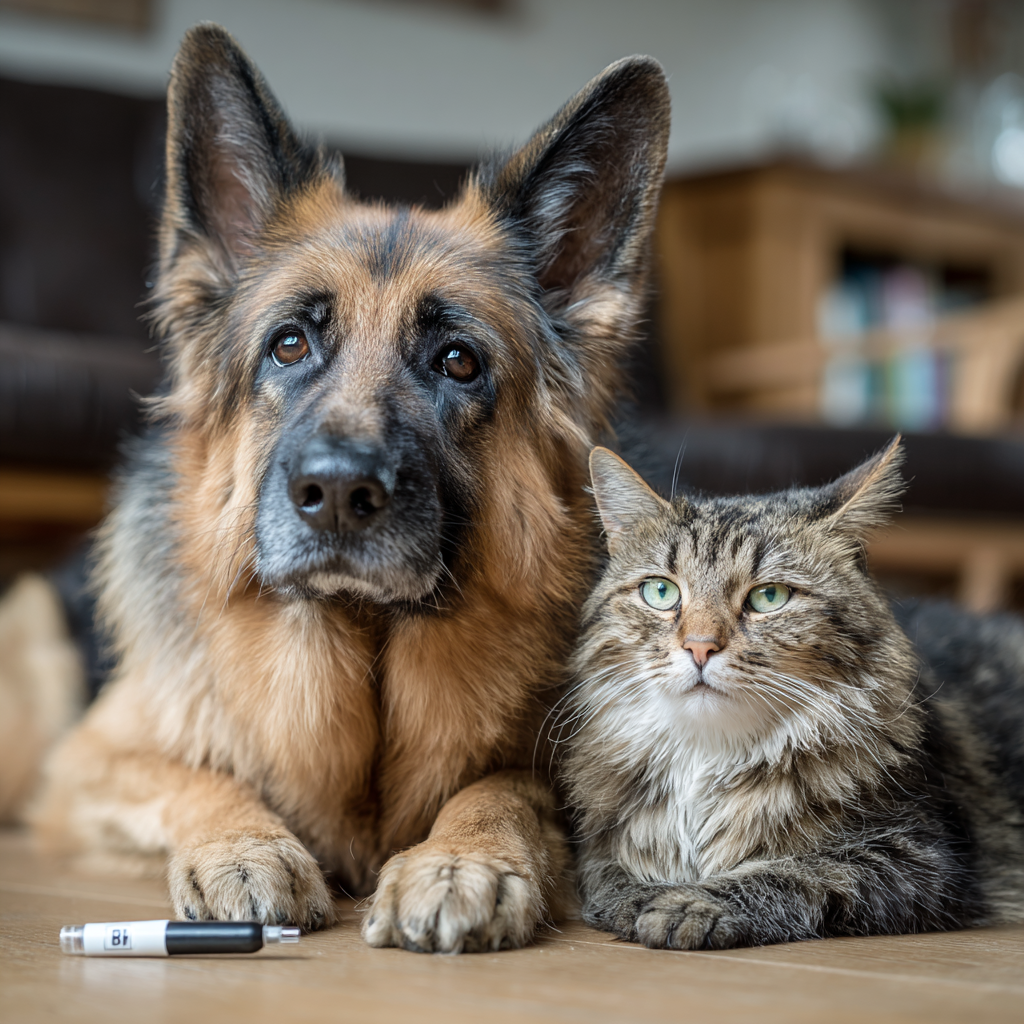
Species-Specific Calibration and Why It Matters
Because dogs, cats, and humans partition glucose differently between plasma and erythrocytes and have distinct hematocrit ranges and red cell membrane properties, a veterinary meter must apply species-specific calibration curves to convert sensor current into an accurate blood glucose value. You’re correcting for species-specific differences in erythrocyte volume fraction, intracellular water, and glucose permeability that bias enzyme-mediated current. Hematocrit alters diffusion, viscosity, and mediator kinetics; calibration importance grows at extremes. Select the correct species mode to adjust slope, intercept, and hematocrit compensation. Otherwise, canine results skew low, feline results skew high, and trend data mislead dosing algorithms and clinical decisions.
When to Use a Meter at Home vs. In Clinic
When should you check glucose at home versus in the clinic? Use home monitoring for routine trend analysis, stress-free baselines, and rapid feedback after dose changes. It captures diurnal variation and meal/exercise effects, reducing white-coat hyperglycemia. Deploy clinic testing for calibration verification, device comparison against lab analyzers, and complex cases with suspected comorbidities or hypoglycemia unawareness. In clinic, you’ll leverage hematocrit assessment, ketone checks, and controlled timing to validate meter accuracy. At home, continuous data density informs algorithms for dose titration. Combine both: home for high-frequency datasets; clinic for periodic audits, curve confirmation, and protocol pivots when physiology or outcomes drift.
Step-by-Step: Collecting a Sample and Getting a Reading
Home datasets pair best with flawless technique, so execute each reading the same way to control pre-analytical variables. Calibrate meter and strips by lot; verify date and temperature range. Prepare site: warm ear or paw, dry thoroughly, avoid alcohol residue. Use a fresh lancet; produce a 3–5 µL drop. Prioritize capillary action—touch the strip edge to the bead, don’t smear. Time-stamp the sample collection. Confirm the meter’s fill indicator; reject partial fills. During the reading process, minimize motion and hematocrit extremes. Record result, strip lot, site, and any stressors. Dispose sharps safely. Repeat inconsistent values with a new strip and fresh drop.
Interpreting Numbers: Targets, Trends, and Alerts
You’ll start by defining target range guidelines with your veterinarian, aligning meter readings to species-specific, time-of-day, and feeding/insulin timing. Next, you’ll analyze trend patterns over time—glucose curves, rate-of-change, and variability—to distinguish measurement noise from clinically meaningful shifts. Finally, you’ll set alert thresholds and actions so that defined low/high cutoffs trigger rapid steps (recheck, feed, adjust insulin per plan, or seek urgent care).
Target Range Guidelines
Although individual patients vary, define a clear target range before acting on readings: for most stable dogs on insulin, aim for roughly 90–180 mg/dL (5.0–10.0 mmol/L) during the day, and for cats, 80–200 mg/dL (4.4–11.1 mmol/L), with nadirs typically 80–120 mg/dL in dogs and 70–140 mg/dL in cats. Anchor decisions to physiology: match insulin action curves to expected glucose levels, prioritize hypoglycemia avoidance, and validate meter accuracy with periodic lab comparisons. Use target ranges to gate dosing adjustments, feeding timing, and exercise. Trigger alerts near 80–90 mg/dL to preempt drops; flag sustained readings above 250 mg/dL for ketone checks and clinical reassessment.
Trend Patterns Over Time
When you look beyond single readings, patterns reveal how insulin kinetics, meals, stress, and activity reshape glucose curves across days. You’ll map nadirs, rebound hyperglycemia, and dawn phenomena, then quantify variability with standard deviation, coefficient of variation, and time-in-range. Apply trend analysis to compare pre- and post-dose slopes, identifying delayed absorption, inadequate duration, or stacking. Use data visualization—daily overlays, modal day plots, and heatmaps—to expose recurring lows after exercise or spikes with corticosteroids. Align sampling with dosing and feeding to reduce noise. Validate anomalies with repeated measures. Iterate protocols based on mechanisms, not anecdotes, to optimize stability and clinical efficiency.
Alert Thresholds and Actions
Set explicit alert thresholds to convert raw meter data into timely clinical actions. Define alert levels using species‑specific targets, meter bias, and preanalytical variance. Anchor hypoglycemia alerts near 60–70 mg/dL for dogs and cats, then adjust for hematocrit and sample timing. Set hyperglycemia alerts higher during stress or steroid therapy. Pair each threshold with action plans: confirm with a second reading, give dextrose if symptomatic, modulate insulin dose, or advance feeding. Escalate when rapid downward trends exceed 2–3 mg/dL/min. Use color‑coded tiers and time‑in‑range metrics to drive decisions, document interventions, and refine individualized protocols continuously.
Common Errors and How to Avoid Them
Even with a calibrated veterinary glucometer, small procedural lapses can skew readings by 10–30% and misguide insulin dosing. You’ll avoid common mistakes by controlling pre-analytic variables. Dry the site; residual alcohol hemolyzes cells and dilutes capillary blood, biasing low. Use a fresh, adequate drop; microclots and underfilling trigger diffusion errors. Minimize tissue squeezing; interstitial fluid lowers glucose by dilution. Match species code; hematocrit algorithms differ. Check temperature range; enzymatic kinetics drift outside spec. Time the strip insertion and sample application precisely; capillary wicking curves assume seconds. When values defy physiology, repeat on a new strip—core troubleshooting tips before therapeutic changes.
Maintenance, Quality Control, and When to Replace Equipment
Although meters look rugged, their accuracy depends on routine care and objective checks. Clean the optics and strip port weekly; remove protein residues that scatter light and skew amperometry. Store strips dry, 15–30°C, capped. Verify performance daily with two-level controls; document bias, CV, and lot-to-lot shifts. Schedule routine calibration against a reference analyzer monthly to safeguard equipment longevity. Replace batteries proactively; voltage sag increases measurement drift. Flag replacement when controls fall outside limits twice, correction fails, or mean absolute relative difference exceeds 15%. Retire units after 2–3 years or 5,000 tests, damaged electrodes, cracked housings, or inconsistent strip detection.
Conclusion
You’ve seen how species-calibrated meters, tiny sample volumes, and proper technique drive accurate, actionable glucose data. Use home checks for trends; reserve curves, ketone flags, and complex cases for the clinic. Follow QC schedules, replace strips on expiry, and verify against lab values. One striking stat: up to 20–25% of readings can be off if you use human strips on pets. Nail sampling, interpretation, and maintenance, and you’ll catch hypoglycemia early and optimize insulin with clinical precision.